
Betting Strategies
 Available in US
The NHL remains one of the most undervalued betting markets in professional sports. While the NFL draws the sharpest lines and the NBA attracts recreational bettors with flashy parlays, hockey quietly offers something different: inefficiencies that a prepared bettor can exploit. The sportsbooks know football inside out, but hockey? That’s where preparation meets opportunity.
This guide breaks down the strategies that separate profitable NHL bettors from everyone else. You won’t find generic advice here about “doing your research” or “managing your bankroll.” Instead, you’ll learn the specific statistical frameworks, situational angles, and market dynamics that give serious bettors an edge. Whether you’re looking to refine an existing approach or build a system from scratch, the goal is simple: make smarter bets than the person on the other side of the counter.
Hockey betting rewards those who understand that a game isn’t just about which team has more talent. It’s about which goalie is starting, how many miles a team traveled yesterday, whether the power play has been clicking, and a dozen other factors that casual bettors ignore. The sportsbooks account for the obvious stuff. Your job is to find what they miss.
See also advanced statistics for betting.
Why Strategy Matters in NHL Betting
The NHL betting market is softer than you might expect. Compared to the NFL, where every line is scrutinized by thousands of sharp bettors and adjusted within minutes, hockey lines often sit unguarded. The reason is straightforward: less betting volume means less incentive for sportsbooks to invest in razor-sharp pricing. This creates pockets of value that simply don’t exist in football.
Consider the practical implications. When an NFL line moves from -3 to -3.5, it often reflects millions of dollars in sharp action and genuine information being priced into the market. When an NHL line moves from -150 to -160, it might just be the book balancing recreational money. The signal-to-noise ratio is different. Understanding this distinction is fundamental to approaching hockey betting with the right mindset.
Finding edges in the NHL requires preparation that goes beyond checking the standings. You need to know which goalie is starting before the market does. You need to understand why a team’s record might not reflect their true quality. You need to recognize when a line is off because the book is being lazy, not because they know something you don’t. The edge comes from doing work that most bettors won’t do.
None of this means hockey betting is easy. The sportsbooks aren’t stupid, and the margins are thin even in inefficient markets. But the opportunity exists for bettors willing to dig deeper than the box score. In football, you’re competing against armies of professionals. In hockey, you’re often competing against casual fans who bet on their favorite team. That’s a winnable fight.
Goaltending Analysis Deep Dive

Goaltending is the single most important factor in hockey betting, and it’s not particularly close. A starting goalie can be worth 15 to 30 cents on the moneyline, which means ignoring goalie information is essentially lighting money on fire. Every serious NHL bettor builds their process around goaltending analysis.
Save Percentage Benchmarks
Save percentage (SV%) measures the percentage of shots a goalie stops. League average in 2026 hovers around .900, which means the typical goalie allows roughly 10 goals per 100 shots. Elite goalies consistently post numbers above .915, while struggling goalies might dip below .895. These differences might seem small, but they compound over 30-plus shots per game.
A goalie with a .920 SV% facing 30 shots is expected to allow 2.4 goals. The same 30 shots against a .900 goalie yields 3.0 goals. That 0.6-goal difference is enormous in a sport where games regularly finish 3-2 or 4-3. When you’re betting totals or evaluating moneyline value, understanding where a goalie falls on the SV% spectrum is non-negotiable.
However, raw save percentage has limitations. Not all shots are created equal. A goalie facing 30 shots from the perimeter will have a higher SV% than one facing 30 shots from the slot, even if both goalies are equally skilled. This is where advanced metrics become essential.
Expected Goals Against and Goals Saved Above Expected
Expected Goals Against (xGA) measures the quality of shots a goalie faces, assigning each shot a probability of becoming a goal based on factors like location, shot type, and game situation. Goals Saved Above Expected (GSAx) then compares a goalie’s actual performance against this expectation. A goalie with positive GSAx is stopping more pucks than an average goalie would against the same shots.
GSAx is arguably the best single metric for evaluating goaltender performance. It separates the goalie’s skill from the team defense in front of him. A goalie posting a .910 SV% behind a porous defense that allows high-danger chances might actually be outperforming one with a .920 SV% on a team that suppresses shot quality. The raw numbers lie; GSAx tells the truth.
For betting purposes, look for goalies whose GSAx suggests their SV% is sustainable or likely to regress. A goalie with elite GSAx but mediocre SV% might be due for positive regression as his luck evens out. Conversely, a goalie with negative GSAx but strong SV% is probably benefiting from an unsustainable run of fortune.
Goalie Confirmation Sources
Knowing who’s starting sounds obvious, but the timing matters enormously. Lines often adjust significantly once goalies are confirmed, so getting this information early provides a real edge. Daily Faceoff publishes projected starting goalies each morning, though these projections aren’t always accurate. Beat reporters for individual teams often tweet confirmations during morning skate, typically between 10:30 and 11:30 AM local time.
The smart play is to have a system for monitoring goalie news across multiple sources. Following team beat reporters on social media, checking Daily Faceoff updates, and monitoring line movements can help you identify when the market hasn’t yet priced in a goalie change. If you know a backup is starting before the line moves, you’ve found value.
Backup Goalie Scenarios
Backup goalies represent some of the best betting opportunities in hockey. When a starter gets injured or rested, the line adjustment is often insufficient because books are conservative about moving numbers on late-breaking news. A team favored at -180 with their starter might only move to -150 with the backup, even if the talent gap suggests a bigger shift.
The key is knowing which backups are competent and which are genuine liabilities. Some teams have strong tandem situations where the backup is nearly as good as the starter. Others have backups who post sub-.890 numbers and crater the team’s chances. Building a mental database of backup goalie quality pays dividends throughout the season.
Advanced Statistics for NHL Betting

Traditional hockey stats like goals, assists, and plus-minus are useful for fantasy sports but largely useless for betting. The modern NHL betting landscape demands fluency in possession metrics and expected goals models. These numbers reveal whether a team’s results are sustainable or built on sand.
Corsi and Why It Matters
Corsi measures shot attempt differential at even strength. If a team has 60 shot attempts and allows 40, their Corsi For percentage (CF%) is 60%. The logic is intuitive: teams that generate more shot attempts than they allow are generally controlling play and creating more opportunities to score.
For betting purposes, Corsi helps identify teams whose results don’t match their process. A team with a losing record but strong Corsi numbers (above 52%) is likely experiencing bad puck luck and due for positive regression. Conversely, a winning team with poor Corsi (below 48%) might be riding unsustainable goaltending or finishing and headed for a fall.
The beauty of Corsi is its sample size efficiency. Goal-scoring is volatile, with significant game-to-game variance based on shooting percentage and save percentage fluctuations. Shot attempts stabilize much faster, often within 20-25 games. Early in the season, when win-loss records can be misleading, Corsi provides a cleaner signal of team quality.
Fenwick Explained
Fenwick is Corsi without blocked shots. The rationale is that blocked shots might reflect a team’s strategy (blocking shots is a skill) rather than their territorial dominance. A team that plays a shot-blocking style will have worse Corsi than Fenwick, even if they’re controlling play effectively.
In practice, Fenwick and Corsi usually tell similar stories. The correlation between the two is extremely high, so focusing on either metric will lead you to similar conclusions. Some bettors prefer Fenwick as a slightly cleaner measure of offensive zone time, but the difference is marginal. Pick one and track it consistently.
Expected Goals Models
Expected Goals (xG) takes shot quality into account, assigning each shot attempt a probability of scoring based on location, shot type, traffic, rebound status, and other factors. A one-timer from the slot during a power play might be worth 0.35 xG, while a point shot through traffic is worth 0.03 xG.
Expected Goals For (xGF) and Expected Goals Against (xGA) reveal whether a team is creating and suppressing quality chances. The difference between xGF and xGA (expected goal differential) is a better predictor of future performance than actual goal differential, especially over sample sizes of 20-40 games.
When a team’s actual goals significantly exceed their expected goals, they’re benefiting from unsustainable shooting or goaltending. This is a regression flag. Similarly, teams with strong xG numbers but poor results are often value bets, as the underlying process suggests improvement is coming.
High-Danger Scoring Chances
Not all xG models are created equal, but virtually all of them weight high-danger scoring chances (HDSC) heavily. High-danger chances come from the slot area, where shooting percentages are dramatically higher than from the perimeter. Teams that consistently generate more HDSC than they allow tend to win over time, regardless of what the scoreboard says in any individual game.
Tracking HDSC differential provides a quick sanity check on xG numbers. If a team has strong xG but their HDSC numbers are mediocre, the model might be overweighting lower-quality chances. If HDSC and xG align, you can have more confidence in the underlying signal.
PDO and Regression to the Mean
PDO combines team shooting percentage and save percentage (the sum of the two). League average is always 100 (or 1.000, depending on how it’s expressed). PDO above 100 suggests a team is running hot, while PDO below 100 suggests they’re running cold.
Here’s the critical insight: PDO is almost entirely luck-driven and regresses aggressively toward 100 over time. A team with 103 PDO through 30 games is not 3% better at shooting and stopping pucks than average. They’re experiencing positive variance that will likely disappear. Betting against high-PDO teams and on low-PDO teams is one of the simplest regression strategies in hockey.
The regression timeline varies, but significant PDO deviations typically correct within 20-30 games. If you spot a team with extreme PDO (above 102 or below 98), you’ve found a regression candidate worth monitoring closely.
Situational Betting Systems
Beyond statistics, situational factors create predictable patterns that bettors can exploit. These aren’t foolproof systems, but they identify spots where the market consistently misprices teams based on circumstances rather than talent.
Back-to-Back Games Fade
NHL teams playing the second game of a back-to-back are at a significant disadvantage. Fatigue affects skating speed, reaction time, and mental sharpness. The backup goalie often starts these games, compounding the problem. Yet sportsbooks don’t always adjust lines sufficiently.
The data is clear: teams playing their second game in two nights underperform expectations. This is especially true on the road, where travel compounds fatigue, and when the first game went to overtime, adding extra minutes to already tired legs. Fading back-to-back teams in these spots has been a profitable angle for years.
The market has become somewhat efficient at pricing obvious back-to-back situations, so you need to dig deeper. Look for teams finishing long road trips, playing their third game in four nights, or facing a rested opponent who had several days off. The more compounding fatigue factors, the stronger the fade.
Betting on Losing Streaks
When a team loses four or five games in a row, the public piles on, assuming the sky is falling. This creates value on the losing team, who are often better than their recent results suggest. Hockey is volatile, and even good teams have bad stretches driven by poor puck luck rather than genuine decline.
The key is identifying whether the losing streak reflects real problems or random variance. Check the underlying metrics: if a team’s Corsi, xG, and HDSC numbers remain strong despite the losses, they’re likely due for regression to the mean. If the process has also cratered, the losses might be legitimate.
Teams coming off losing streaks often face inflated opponents as well. The public loves betting against “cold” teams and on “hot” teams, even when recent results are mostly noise. Fading public perception in these spots can be profitable.
Home Ice After Road Trips
Teams returning home after extended road trips (four or more games) tend to perform well. They’re sleeping in their own beds, practicing in their own facilities, and enjoying the energy of a home crowd after days of hostile environments. The psychological and physical boost is real.
This angle works best when the road trip was grueling but the team performed reasonably well. A team that went 2-3 on a tough western road swing might be undervalued coming home, while one that got blown out five straight times probably has larger problems.
Rivalry Game Analysis
Rivalry games produce tighter outcomes than the talent gap suggests. When divisional rivals meet, especially teams with playoff implications or historical beef, the underdog tends to cover more often than in non-rivalry spots. Emotion and physicality level the playing field.
The betting angle here is simple: favor underdogs in rivalry matchups, especially when the favorite is laying significant juice. The intensity of these games makes blowouts less likely, which helps the underdog cover the puck line and sometimes steal games outright.
Special Teams Exploitation
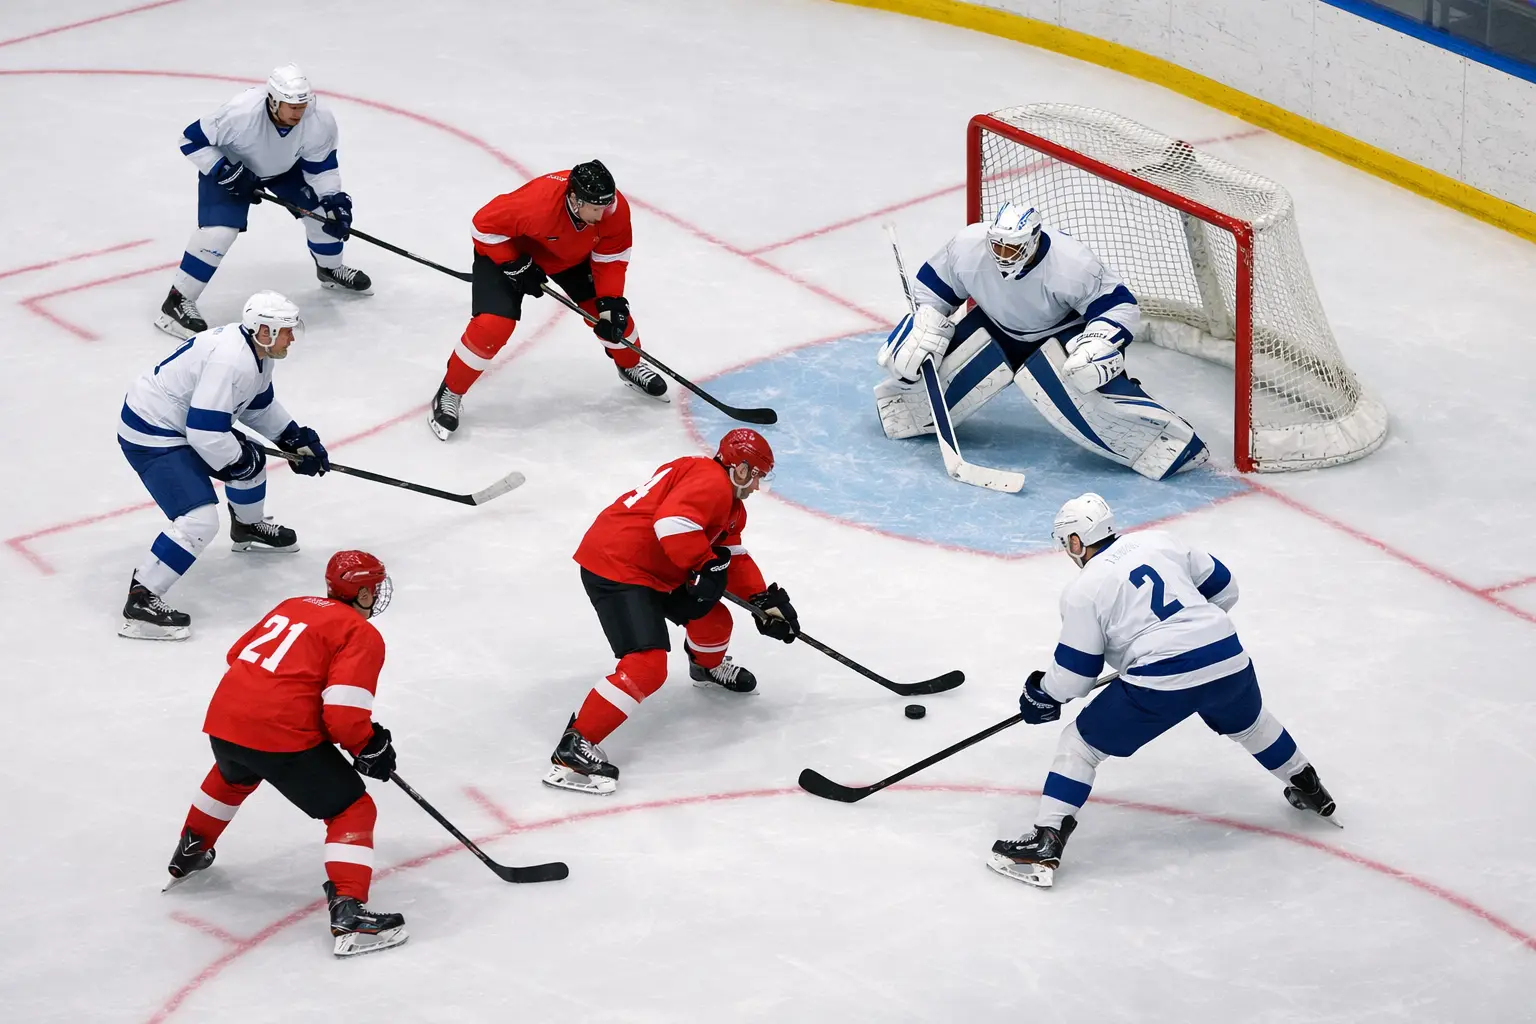
Power plays and penalty kills create significant scoring variance in hockey. A team’s 5-on-5 play determines their baseline quality, but special teams can swing individual games dramatically. Identifying mismatches in special teams creates betting opportunities.
Power Play vs. Penalty Kill Mismatches
When a team with a top-five power play faces a team with a bottom-five penalty kill, the expected scoring goes up significantly. These mismatches are especially valuable for totals betting. If both teams have strong power plays and weak penalty kills, the game is likely to feature more goals than the posted total suggests.
Conversely, games between two elite penalty kill teams with mediocre power plays tend to go under. Special teams cancel out to some degree, but the net effect of two strong PKs and two weak PPs is fewer power play goals than a typical game.
Net Power Play Percentage
Net power play percentage combines PP% and PK% into a single number (PP% minus (100 minus PK%)). This metric captures overall special teams quality in one figure. Teams with positive net PP% are gaining an edge on special teams; negative net PP% teams are losing ground.
For game analysis, compare the net PP% of both teams. A significant gap suggests one team will likely benefit from special teams situations, which can influence totals and even moneyline value. The market doesn’t always price special teams efficiency correctly, especially early in the season when sample sizes are small.
Spotting Inefficient Special Teams
Special teams percentages are noisy and prone to regression. A team with a 28% power play through November is almost certainly running hot and will regress toward the 20-22% league average. Similarly, a 70% penalty kill will improve as the sample grows.
Identify teams whose special teams numbers are outliers and bet on regression. If a team’s strong record is built on unsustainable special teams success, they’re a candidate to fade. If a team’s losses are partly due to historically bad special teams, their underlying quality might be better than results suggest.
Line Movement and Sharp Action
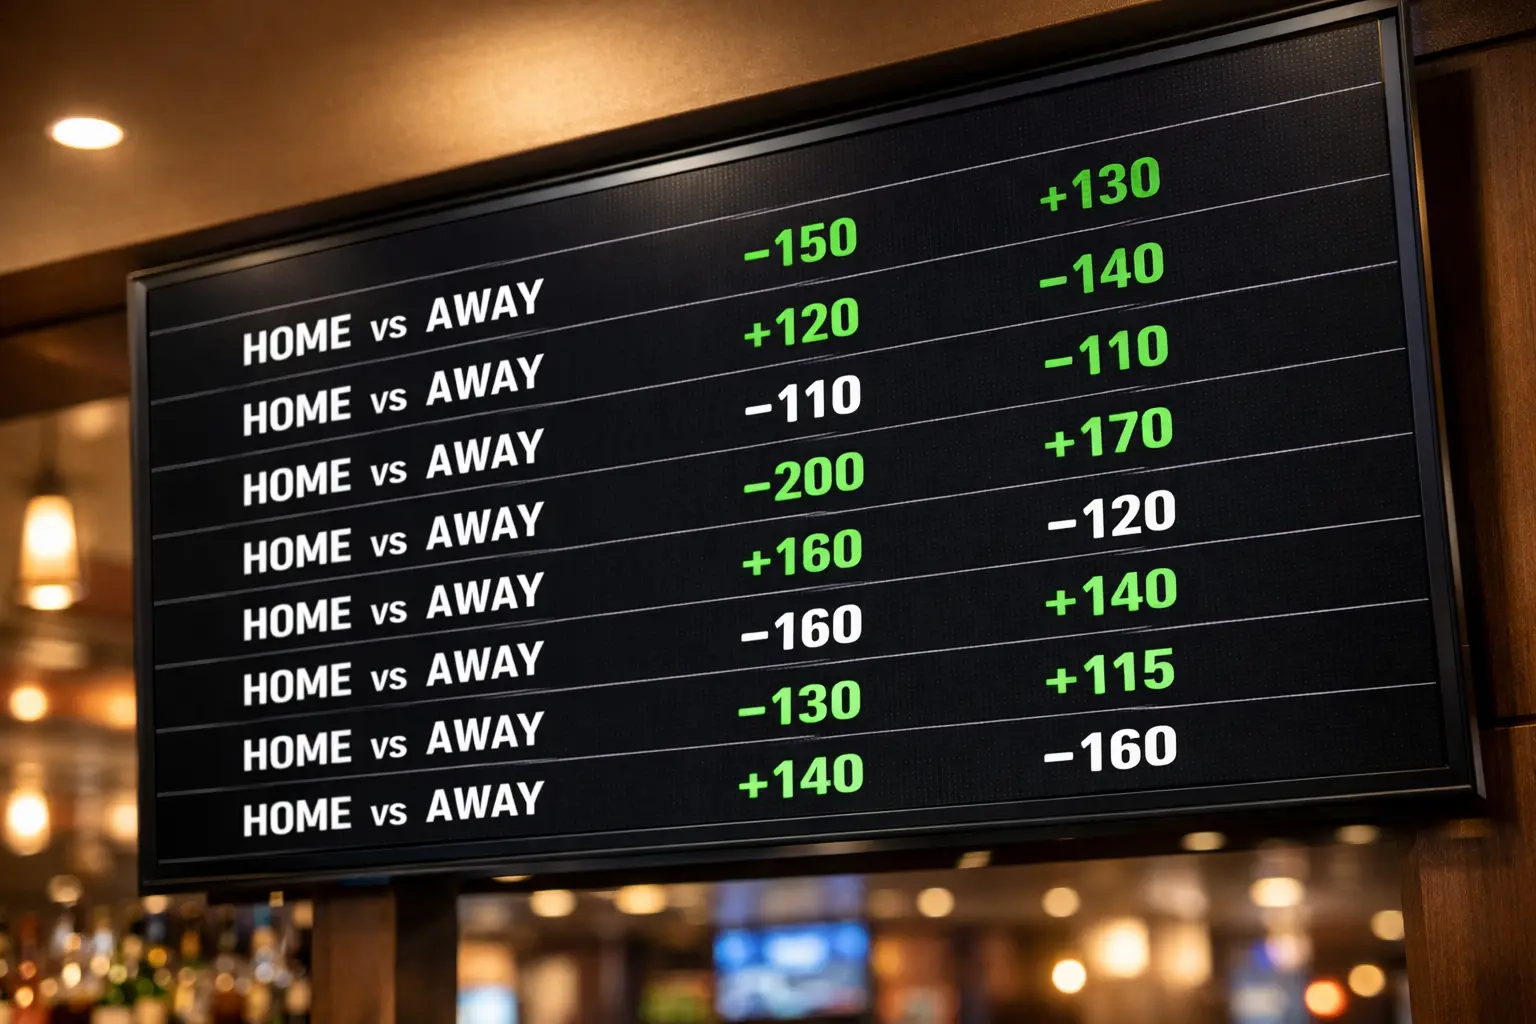
Understanding why lines move separates sophisticated bettors from recreational ones. Not all line movement is meaningful, and learning to read the tea leaves helps you identify whether you’re on the right side of the market.
Reading Line Movement
Lines move for two primary reasons: balanced action and sharp action. When a sportsbook takes heavy one-sided betting, they might move the line to attract action on the other side. When sharp bettors hit a line, the book moves it because they respect the sharp’s opinion. Distinguishing between these scenarios is crucial.
Sharp action typically comes in large, confident amounts at specific odds. If a line opens at -150 and immediately moves to -165 without obvious news, sharp bettors probably found value on the favorite. Following this movement can help you identify where the smart money is landing.
However, line movement near game time often reflects recreational money rather than sharp action. Public bettors tend to bet favorites and overs, especially on nationally televised games. Late movement toward the favorite or over is often noise rather than signal.
Reverse Line Movement Signals
Reverse line movement occurs when the line moves opposite to the betting percentages. If 70% of bets are on Team A but the line moves in Team B’s favor, the books are essentially telling you that the 30% on Team B includes sharp bettors whose money they respect more than the 70% of recreational action.
Reverse line movement isn’t a perfect indicator, but it’s worth noting. When you see a line moving against public sentiment, dig deeper. There might be information in the market that isn’t reflected in the betting percentages. At minimum, reverse line movement should make you pause before betting with the public.
When to Bet Early vs. Wait
Timing your bets is more art than science, but some guidelines help. If you have strong conviction based on information the market might not have (like early goalie news), bet early before the line adjusts. If you’re betting a popular position that will attract public money, wait for the line to move in your favor.
For underdogs, early betting often provides better prices because recreational money tends to push favorites later. For overs, waiting can help since public money typically inflates totals throughout the day. The optimal timing depends on your position and reading of the market.
Sample NHL Betting Systems

Betting systems aren’t magic formulas, but they provide structured approaches to identifying value. The following systems have shown historical profitability, though past performance never guarantees future results.
Fading Public Favorites
When a team is a heavy favorite (above -200) and draws significant public betting (above 70%), fading them has been historically profitable. The public overvalues favorites, especially popular teams, and the sportsbooks often shade lines toward public money rather than sharp money.
This system works best in regular season games without significant playoff implications. The public loves betting on dominant teams to crush weaker opponents, but hockey’s parity means upsets happen regularly. The underdog doesn’t need to win; they just need to keep it closer than the public expects.
Backing Underdogs in Specific Scenarios
Underdogs offer value in several specific situations: back-to-back games for the favorite, games after long road trips for the favorite, rivalry matchups, and games where the favorite’s goalie situation is uncertain. Combining multiple underdog-friendly factors increases the probability of finding genuine value.
The puck line is particularly interesting for underdogs. Getting +1.5 goals with a capable team means they can lose by a single goal and you still win. In low-scoring hockey, this cushion is significant. Backing underdogs on the puck line in close matchups has been a reliable strategy.
Totals Systems Based on Goalie Matchups
Totals betting becomes much sharper when you account for goaltending. When two elite goalies face off, the under is typically valuable because both teams will struggle to score. When backup goalies start on both sides, the over becomes attractive because the goaltending quality drop makes goals easier to come by.
The specific threshold varies, but matchups featuring two goalies with above-average GSAx tend to go under, while matchups featuring two below-average goalies go over. Combining goaltending analysis with pace-of-play metrics (how many shots each team generates and allows) refines this system further.
Building Your Own Approach
The strategies outlined here aren’t meant to be followed blindly. They’re building blocks for constructing a personalized approach that fits your risk tolerance, available time, and betting goals. The most successful NHL bettors combine multiple edges, knowing that no single factor guarantees profit.
Start by tracking your bets meticulously. Record the reasoning behind each wager, the relevant statistics, the line you got, and the result. Over time, patterns will emerge. Maybe your goalie-based bets crush but your special teams angles underperform. Maybe you’re better at spotting value in totals than moneylines. Let the data guide your evolution.
The NHL market rewards patience and discipline. You don’t need to bet every game. You need to bet the games where you have an edge. If tonight’s slate doesn’t offer value, sit it out. There are 1,312 regular season games plus playoffs. The opportunities will come. Your job is to be ready when they do, armed with the statistical frameworks and situational awareness to recognize value when it appears.
Hockey betting isn’t about predicting who wins. It’s about finding spots where the market’s price doesn’t match reality. That distinction makes all the difference.
NHL betting strategies at ice hockey bets.
