
Special Teams Analysis: Power Play and Penalty Kill Betting Edge
 Available in US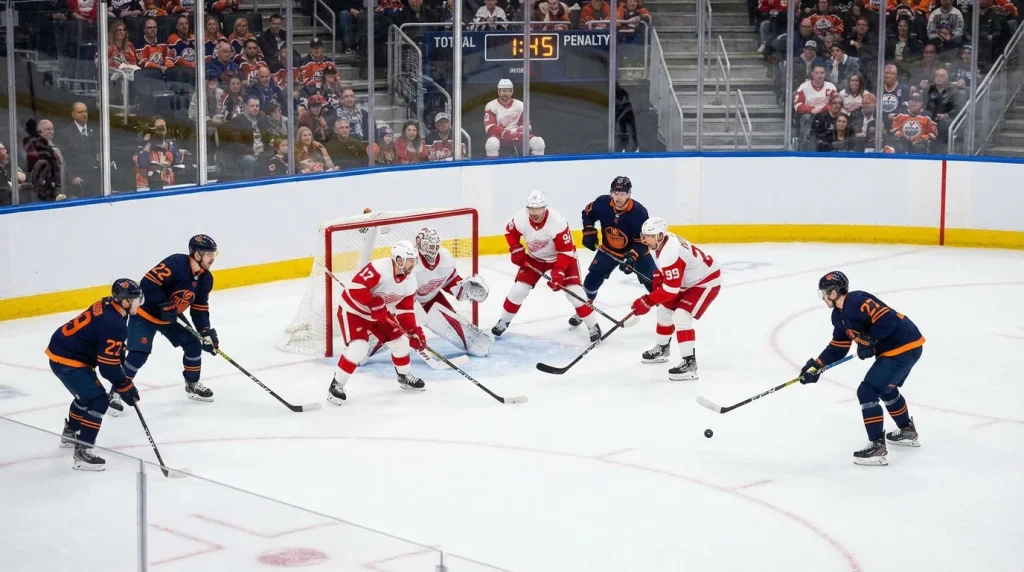
Hockey is the only major team sport where a rule infraction immediately changes the number of players on the playing surface. A tripping penalty doesn’t result in a free throw or a penalty kick — it removes a human being from the ice for two minutes, creating a five-on-four advantage that transforms the geometry of the game. Power plays generate goals at roughly three to four times the rate of even-strength play, and penalty kills are where fragile leads survive or collapse. For bettors who understand how to evaluate and apply special teams data, this recurring asymmetry is one of the most reliable sources of edge in NHL wagering.
The majority of betting models and public analysis weight five-on-five play most heavily, and for good reason — teams spend about 75-80% of game time at even strength. But the remaining 20-25% of the game, played in special teams situations, produces a disproportionate share of the variance that determines winners and losers. Ignoring special teams is like analyzing a restaurant but refusing to taste the food. The ambiance matters, but the meal is the point.
See also advanced statistics for NHL betting.
Power Play Efficiency: More Than a Percentage
The headline number for power play performance is conversion rate — the percentage of power play opportunities that result in a goal. League average hovers around 20-22% in a typical season. Elite units push above 25%, and the worst units struggle below 16%. This gap sounds modest as a percentage, but over the course of a season it translates to a significant scoring differential. A team with a 25% power play that gets four opportunities per game scores an additional 0.12 goals per game from the power play alone compared to a team at 22%. Over 82 games, that’s roughly 10 extra goals — enough to swing a handful of close games.
But conversion rate alone is insufficient for betting analysis because it doesn’t tell you how the goals are being scored. A power play that converts 24% of its opportunities on lucky deflections and one-timer rebounds is less sustainable than one converting at 22% through systematic zone entries, high-quality shot generation, and consistent puck movement. Expected goals on the power play — the quality of chances created relative to opportunities — is a far better indicator of future power play performance than raw conversion rate.
Power play shot volume and shooting percentage are the two components that drive conversion rate, and they have very different predictive properties. Shot volume on the power play is sticky — teams that generate lots of power play shots tend to continue doing so, because shot generation reflects structure, personnel, and coaching. Shooting percentage on the power play is far more volatile, fluctuating around each team’s true talent level with significant noise. A team shooting 18% on the power play through December might regress to 12% by March, not because anything changed but because that’s how small-sample shooting percentages behave.
For betting purposes, this means you should trust power play shot generation metrics more than conversion rate early in the season, and blend the two as the sample grows larger. A team with excellent shot generation but a low conversion rate in November is more likely to improve than one whose high conversion rate is propped up by an unsustainable shooting percentage.
Penalty Kill: The Defensive Mirror
If the power play is offense distilled, the penalty kill is defensive identity revealed. A team’s penalty kill rate — the percentage of opponent power plays killed without a goal — reflects discipline, structure, goaltending, and coaching in roughly equal measure. League average sits around 78-80%, with top units clearing 83% and poor units dipping below 75%.
Penalty kill analysis from a betting standpoint follows the same logic as power play analysis: look beyond the headline number. A penalty kill that suppresses shot attempts and limits high-danger chances is sustainably strong. A penalty kill with average shot suppression but a .940 shorthanded save percentage is riding goaltending luck that will eventually normalize. Expected goals against on the penalty kill is the best single metric for evaluating whether a team’s kill is genuinely elite or artificially inflated.
Shorthanded save percentage is the most volatile component of penalty kill performance and the one most likely to regress toward the mean. Goaltenders facing power play shots are dealing with a smaller sample than at even strength, and the quality of shots is higher. A goalie stopping 94% of power play shots through 30 games might settle at 88% over the full season as regression kicks in. This regression can cause a team’s headline penalty kill rate to decline even if their shot suppression stays constant — a dynamic that creates betting opportunities if the moneyline hasn’t adjusted for the likely regression.
Matchup-Based Special Teams Strategy
The real edge in special teams betting comes not from evaluating teams in isolation but from analyzing how specific special teams units match up against each other. A top-five power play facing a bottom-five penalty kill is an obvious advantage, but the magnitude of that advantage varies depending on the specific styles involved.
Power play units built around perimeter shooting and point-shot volume are less effective against penalty kills that pack the middle and force shots from distance. These shots are lower quality, and a well-positioned goaltender stops them at high rates. Conversely, power plays that emphasize cross-ice movement, net-front screens, and pass-to-shoot sequences from the half-wall are more effective against penalty kills that play aggressively, because the aggressive positioning creates seams and passing lanes.
For bettors, this matchup analysis informs totals and team total bets more directly than moneylines. If tonight’s game features two top-ten power plays against two bottom-ten penalty kills, the expected goal total from special teams alone could exceed one full goal above the base rate. That additional goal needs to be accounted for in the totals line, and it sometimes isn’t — particularly in mid-week games between non-marquee teams where the odds are set with less granularity.
Team-specific penalty rates also feed into matchup analysis. Some teams are chronically undisciplined, committing penalties at rates that put them shorthanded five or six times per game. Others play clean, structured hockey that limits penalties to two or three per game. When a high-penalty team faces an opponent with a dangerous power play, the combined effect on expected scoring is substantial. Tracking penalties taken per 60 minutes alongside opponent power play efficiency creates a more complete picture than either metric alone.
Penalty Drawing and Its Betting Implications
An underexplored angle in special teams betting is which teams and players draw the most penalties. Penalty drawing is a genuine, repeatable skill — certain forwards draw penalties at rates two or three times the league average because of how they play. Speed, aggression, willingness to drive the net, and the ability to protect the puck in tight spaces all provoke defensive infractions. Teams with multiple high-penalty-drawing forwards spend more time on the power play, which amplifies the value of their power play unit.
This skill matters for betting because the line doesn’t always fully account for penalty frequency differentials. When a team with elite penalty drawers faces a team known for taking frequent penalties, the number of power play opportunities in the game is likely to exceed the average. More power play time means more goals, and more goals pushes totals upward. If the posted total is set based on league-average special teams time, there’s an argument for the over.
Individual penalty drawing rates also create player prop opportunities. Forwards who draw penalties tend to be the same ones generating shots and scoring chances, because penalty drawing correlates with offensive aggression. A player who draws two penalties per game is spending extra time on the power play, which inflates his point production and shot totals beyond what his even-strength role would suggest. Props on these players — particularly assists and shots on goal — might be set based on total ice time or historical averages that don’t fully weight the penalty-drawing component.
When Special Teams Data Misleads
Special teams metrics deserve a healthy dose of skepticism in certain contexts. Early in the season, small sample sizes make both power play and penalty kill rates unreliable. A team might be 5-for-8 on the power play through three games — a 62.5% conversion rate — which tells you almost nothing about their true ability. Sportsbooks are generally skeptical of early-season special teams numbers, but the betting public is not, and lines can be distorted by recency bias when a team’s power play is on a visible hot or cold streak.
Coaching changes also reset the special teams equation. A new head coach or special teams coordinator might install a completely different system, rendering all historical data from the previous coaching staff irrelevant. The market often takes several weeks to fully adjust to new special teams schemes, creating a window where the lines reflect the old system’s performance while the new system is already in effect.
The Invisible Goal
There’s a concept in hockey analytics sometimes called the “invisible goal” — the power play or penalty kill performance that doesn’t result in a goal but still shapes the game. A power play that spends 90 seconds in the offensive zone, generates three high-quality chances, and doesn’t score still accomplished something significant: it tired the opposing penalty killers, prevented the opponent from generating any offense for two minutes, and maintained psychological pressure that carries over to even-strength play.
For bettors, the invisible goal is a reminder that special teams impact extends beyond the goals they directly produce. Teams with strong power plays that don’t convert still benefit from the territorial advantage and energy expenditure they impose. Teams with strong penalty kills that occasionally allow a goal still benefit from the structural discipline that limits damage. The scoresheet captures the goals. The betting edge lives in understanding everything the scoresheet misses — the shifts in momentum, the matchup advantages created by penalty situations, and the cumulative fatigue that special teams play imposes on opponents who can’t stay out of the box. The goal you see on the highlight reel is the tip of the iceberg. The special teams process underneath it is where the betting value freezes solid.
Special teams analysis for betting at ice hockey bets.
